Press release —
FULL YEAR 2014-15 RESULTS
Results fully in line with objectives
- Revenues of €1,476m up 4.0% like-for-like[1], and 9.5% on a reported basis
- High level of profitability: EBITDA margin of 76.7%
- Group share of net income up 17% to €355m
- Proposed dividend increase to €1.09 per share, payout ratio of 70%
- Outlook: Revenue growth of 2-3% for current year, accelerating to 4-6% in 2016-17
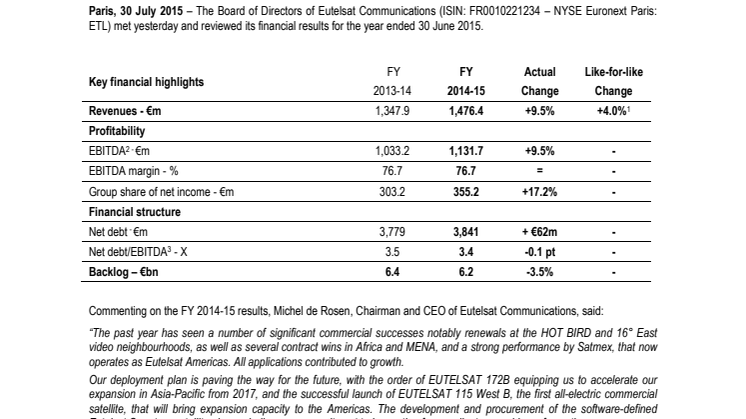
Paris, 30 July 2015 – The Board of Directors of Eutelsat Communications (ISIN: FR0010221234 – NYSE Euronext Paris: ETL) met yesterday and reviewed its financial results for the year ended 30 June 2015.
| Key financial highlights | FY 2013-14 | FY2014-15 | ActualChange | Like-for-likeChange |
| Revenues - €m | 1,347.9 | 1,476.4 | +9.5% | +4.0%1 |
| Profitability | ||||
| EBITDA[2] - €m | 1,033.2 | 1,131.7 | +9.5% | - |
| EBITDA margin - % | 76.7 | 76.7 | = | - |
| Group share of net income - €m | 303.2 | 355.2 | +17.2% | - |
| Financial structure | ||||
| Net debt - €m | 3,779 | 3,841 | + €62m | - |
| Net debt/EBITDA[3] - X | 3.5 | 3.4 | -0.1 pt | - |
| Backlog – €bn | 6.4 | 6.2 | -3.5% | - |
Commenting on the FY 2014-15 results, Michel de Rosen, Chairman and CEO of Eutelsat Communications, said:“The past year has seen a number of significant commercial successes notably renewals at the HOT BIRD and 16° East video neighbourhoods, as well as several contract wins in Africa and MENA, and a strong performance by Satmex, that now operates as Eutelsat Americas. All applications contributed to growth.
Our deployment plan is paving the way for the future, with the order of EUTELSAT 172B equipping us to accelerate our expansion in Asia-Pacific from 2017, and the successful launch of EUTELSAT 115 West B, the first all-electric commercial satellite, that will bring expansion capacity to the Americas. The development and procurement of the software-defined Eutelsat Quantum satellite also underlines our commitment to innovation for our clients as a driver of growth.
Revenue growth for 2015-16 is targeted at 2-3%, reflecting the impact of Russian contract renegotiations, delays to our launch schedule and the current pressure on Government Services. In 2016-17 it should accelerate to 4-6%, thanks to the arrival of new capacity for fast-growing markets, albeit with a delay of EUTELSAT 65 West A. Revenues will continue to be underpinned by our solid backlog, representing over four years of revenues, as well as the positive dynamics in our targeted growth markets and applications. We remain committed to generating value for our shareholders, with a proposed dividend this year up 6% to €1.09, representing a payout ratio of 70%.”
REVENUES[4]
Total revenues for FY 2014-15 stood at €1,476.4 million, up 4.0% on a pro-forma basis at constant currency and excluding non-recurring revenues. The appreciation of the dollar relative to the euro added 3.2 points to top-line growth, particularly in Government Services and to a lesser extent in Data Services. On a reported basis revenues were up 9.5% including the impact of changes in perimeter (acquisition of Satmex and disposal of KabelKiosk).
In the context of the current economic environment in Russia, Eutelsat entered into discussions with its Russian clients with the aim of alleviating some contract terms. The impact on FY 2014-15 revenues was around €2 million.
Revenues for the Fourth Quarter stood at €385.9 million, up 2.1% year-on-year like-for-like. The appreciation of the dollar relative to the euro added 7.4 points to top-line growth.
Revenues by business application
|
In € millions |
FY 2013-14 reported | FY 2013-14 restated | FY 2014-15 | Actual change | Like-for-like change |
| Video Applications | 877.2 | 872.3 | 913.0 | +4.7% | +3.5% |
| Data Services | 189.8 | 209.2 | 226.6 | +8.3% | +1.3% |
| Value-Added Services | 88.7 | 88.7 | 102.4 | +15.4% | +14.8% |
| Government Services | 157.8 | 174.7 | 196.5 | +12.5% | +2.6% |
| Other revenues | 33.9 | 32.4 | 37.9 | +17.1% | +15.9% |
| Sub-total | 1,347.4 | 1,377.3 | 1,476.4 | +7.2% | +4.0% |
| Non-recurring revenues | 0.5 | 0.5 | - | na | na |
| Total | 1,347.9 | 1,377.8 | 1,476.4 |
|
|
| EUR/USD exchange rate | 1,360 | - | 1,228 | +7.2% | +4.0% |
Video Applications (63% of revenues)
For FY 2014-15, revenues from Video Applications were up 3.5% like-for-like to €913 million. This mainly reflected the entry into service of the Express-AT1 satellite in May 2014, the good performance of Eutelsat Americas, resources added in September 2013 to the 7°/8° West position (covering MENA) as well as growth at 16° East (Sub-Saharan Africa and Central Europe), 36° East (Russia and Sub-Saharan Africa) and 7° East (Middle East and Africa).
This performance more than offset the negative impact of the renegotiation during the second half of contracts with Russian customers for around €2 million, as well as lower revenues at 28.5° East and the non-renewal of contracts with some service providers at the HOT BIRD position.
Contracts signed during the year included the multi-year renewal of seven transponders at the HOT BIRD neighbourhood by the Polish pay TV operator, nc+, the long-term extension of capacity agreements on EUTELSAT 16A by Total TV, the leading TV and broadband service provider in South-Eastern Europe, and multiple contract wins in Africa.
Fourth Quarter revenues amounted to €235.3 million, up 3.3% like-for-like on a year-on-year basis, and by 3.3% quarter-on- quarter. They benefited from the ramp-up of some African contracts as well as several non-recurring items, the most significant being the provision of capacity for the “Expo Milano 2015” Universal Exhibition.
At 30 June 2015, the total number of channels broadcast by Eutelsat satellites stood at 5,793 (+47 channels year-on-year). HDTV penetration continued to increase, representing 11.9% of channels compared to 10.2% a year earlier. A total of 687 channels were broadcast in High Definition across Eutelsat’s fleet, up from 584 a year earlier
Data (16% of revenues)
For FY 2014-15, revenues from DataServices were up 1.3% like-for-like to €226.6 million.
This growth reflected the ongoing positive dynamics in Latin America where Eutelsat Americas continued to deliver strong growth for regular capacity and benefited from the entry into service of the high throughput payload on EUTELSAT 3B for broadband services in Brazil. In the EMEA region, some contracts were signed in MENA notably with telecom operators, although on the whole, the context remained challenging.
Revenues in the Fourth Quarter stood at €61.1million, down 0.3% like-for-like on a year-on-year basis, and by 1.4% quarter-on-quarter.
Value Added Services (7% of revenues)
For FY 2014-15, Value-Added Servicesrecorded strong growth of 14.8% on a like-for-like basis, to €102.4 million.
Services on KA-SAT continued to rise, with 185,000 broadband terminals activated at 30June 2015, up from 154,000 a year earlier, and 180,000 at the end of March.
Fourth Quarter revenues amounted to €27.6 million, up 9.5% like-for-like on a year-on-year basis. Quarter-on-quarter, revenues rose 17.7% reflecting an increase in KA-SAT revenues, the positive seasonal effect of the maritime activity and the absence of a negative one-off that occurred in the Third Quarter.
Government Services (14% of revenues)
For FY 2014-15, revenues from GovernmentServices were up 2.6% like-for-like to €196.5 million.
New contracts at EUTELSAT 33B, EUTELSAT 36B and EUTELSAT 48D and the good performance of Eutelsat Americas helped offset the carry-forward effect of lower contract renewals with the US Department of Defense in the past 18 months.
Fourth Quarter revenues stood at €54.7 million, up 3.1% on a year-on-year basis and by 2.0% quarter-on-quarter.
Visibility in this segment remains low for the coming year, with increasing pricing pressure reflecting the impact of reduced operations, ongoing budgetary constraints and tougher procurement processes.
Other and non-recurring revenues
For FY 2014-15, Other Revenues[5]amounted to €37.9 million compared with €32.4 million a year earlier. They included the full-year impact of revenues related to the agreements concluded with SES at 28.5° East.
There were no Non-Recurring Revenues in FY 2014-15 (€0.5 million last year);
OPERATIONAL AND LEASED TRANSPONDERS
Note: The number of operational and leased transponders has until now been reported on the basis of physical transponders including high throughput spotbeams. To better reflect actual capacity volumes, the number of transponders (operational and leased) and the fill rate are henceforth disclosed on the basis of the number of 36 MHz-equivalent transponders for regular capacity, excluding high throughput capacity. An equivalence table is published in the appendix to this document.
The number of operational 36 MHz-equivalent transponders stood at 1,168 at 30 June 2015, up 46 compared to 30 June 2014, mainly reflecting the entry into service of EUTELSAT 3B, EUTELSAT 7B and Express-AT2 during FY 2014-15 which more than compensated the reduction in capacity at 53° East.
The fill rate stood at 78.7%, compared to 81.2% a year earlier, mostly reflecting the entry into service of the new capacity mentioned above. The increase in fill rate in the Fourth Quarter (78.7% versus 77.6% at the end of March) reflected a reduction in capacity at 53° East and 56° East and new contracts in Africa and Latin America.
The number of operational high throughput spotbeams stood at 87 as of 30 June 2015.
|
|
30 June 2014 | 31 March 2015 | 30 June 2015 |
| Number of operational 36 MHz-equivalent transponders [6] | 1,122 | 1,181 | 1,168 |
| Number of leased 36 MHz-equivalent transponders[7] | 911 | 916 | 919 |
| Fill rate | 81.2% | 77.6% | 78.7% |
Note: Based on 36 MHz-equivalent transponders excluding high throughput capacity (KA-SAT 82 spotbeams and EUTELSAT 3B 5 Ka-band spotbeams).
BACKLOG
Note: The backlog represents future revenues from capacity lease agreements and can include contracts for satellites under procurement.
At 30 June 2015, the backlog stood at €6.2 billion, down 3.5% compared to 30 June 2014. This comes after very strong increase in the previous year of 14% at constant perimeter.
Contracts signed during the year, in particular renewals with nc+ and Total TV as well as contracts signed in Africa and Latin America were offset by backlog consumption and the impact of the renegotiation of Russian contracts. The backlog is equivalent to 4.2 times 2014-15 revenues. 83% is represented by Video.
| As of 30 June | 2013 | 2014 | 2015 |
| Value of contracts (in billions of euros) | 5.4 | 6.4 | 6.2 |
| In years of annual revenues based on last fiscal year | 4.2 | 4.6* | 4.2 |
| Share of Video Applications | 92% | 84% | 83% |
* Including USD 69.0 million revenues for Satmex from July to December 2013.
PROFITABILITY
Group EBITDA amounted to €1,131.7 million (€1,033.2 million at 30 June 2014), up 9.5%, in line with revenue growth.
The EBITDA margin stood at of 76.7%, stable compared to last year, notably reflecting on one hand the leverage from the overall increase in revenues, and on the other, the above average growth of Value-Added Services.
Group share of net income stood at €355.2 million versus €303.2 million in 2013-14, an increase of 17.2%. The net margin stood at 24.1%.This reflected mainly:
The increase in EBITDA;
An increase in the depreciation charge of €65.2 million due principally to the impact of new capacity (Express-AT1, Express-AT2 and EUTELSAT 3B) as well as the full-year effect of the consolidation of Eutelsat Americas (formerly Satmex);
A financial result of -€116.0 million (versus -€132.3 million in 2013-14). This reflects on one hand a positive net currency effect of €21.3 million compared to -€7.4 million last year, and on other, the full-year effect of the bond issued in December 2013.
An effective tax rate of 35.6% compared to 38.6% in 2013-14. This reduction in the tax rate mainly reflects the activation of tax loss carry-forwards in Latin America. Moreover, the tax expense in 2013-14 included a settlement of -€5.6 million.
Net cash flows from operating activities rose 33% to €1,034.6 million, representing 70% of revenues, versus €777.6 million in 2013-14. This reflected mainly the increase in EBITDA (for +€98.5 million), a reduction in tax paid (for +€85.6 million) relating to the evolution of the pretax profit in previous years and the timing of tax payments and a more favourable change in working capital than last year (net impact of +€17.7 million).
Capital expenditure[8] amounted to €493 million in FY 2014-15 compared to €451 million a year earlier, reflecting the consolidation of Eutelsat Americas (Satmex) over the full period, the financial leases on Express-AT1 and Express-AT2 as well as the phasing of various satellite programmes.
FINANCIAL STRUCTURE
Eutelsat continued to optimise its sources of funding through the early refinancing and partial reimbursement of an €800 million bank term loan which will extend its debt maturity and reduce financial charges by circa €15 million before tax on an annualised basis (excluding arrangement fees and hedging instruments).
At 30 June 2015, net debt was broadly stable at €3,841 million versus €3,779 million at 30 June 2014. Free cash-flow generation covered a dividend payment of €87 million, interest and other fees of €149 million, an increase in financial leases of €214 million, due notably to the entry into service of Express-AT2, and the mark-to-market fair value of the foreign exchange portion of the cross-currency swap (for €118 million). The net debt to EBITDA ratio stood at 3.4 times, an improvement compared to 30 June 2014 (3.5 x).
At 30 June 2015, the weighted average maturity of the Group’s debt stood at 4.1 years, down from 4.4 years at 30 June 2014. The average cost of debt was 3.8% (after hedging), down from 4.0% in FY2013-14.
Liquidity remains strong, with cash of €420 million and undrawn credit lines of €650 million.
DIVIDEND
On 29 July 2015, the Board of Directors agreed to submit for approval at the 5 November 2015 Annual Meeting of Shareholders a dividend of €1.09 per share for FY 2014-15 versus €1.03 last year, up 6%.
This represents a pay-out ratio of 70% of Group share of net income, consistent with the group’s policy of a pay-out ratio of 65% to 75%, reflecting its commitment to shareholder remuneration.
Shareholders will be offered the option to receive the dividend in the form of shares (scrip dividend) under similar conditions to last year.
OUTLOOK
Note: The framework for communicating financial objectives has been amended: Objectives for revenue growth at constant currency and excluding non-recurring revenues and for EBITDA margin are henceforth given for each of the current and following year, compared with current year plus the average of the following two years. All other elements of the objectives remain unchanged.
The previous objective was revenue growth of “above 5%” on average for FY 2015-16 and 2016-17 and was based on an initial nominal deployment plan.
Following the recent failures of Proton and Falcon 9 launchers and general pressure on launch manifests, this deployment plan has been revised to integrate delays into orbit of the EUTELSAT 9B, EUTELSAT 36C and EUTELSAT 65 West A satellites.
Based on the new nominal satellite deployment plan, Eutelsat targets revenue growth of 2-3% for FY 2015-16. This also reflects the impact of the renegotiation of Russian contracts and the current pressure on Government Services.In FY 2016-17 growth is set to accelerate, with an objective of 4-6%. This takes into account the entry into service of new capacity, albeit with a delay of EUTELSAT 65 West A.
The EBITDA margin is targeted at above 76.5% for each of the next two fiscal years.
The Group will continue to focus its investment policy on high growth markets in Latin America, Russia, the Middle East, Africa and Asia-Pacific. Average investments[9] will stand at around €500 million a year over the three fiscal years to 30 June 2018.
The group will maintain a sound financial structure to support its investment grade credit rating and aims at a net debt / EBITDA ratio below 3.3x.
The Group remains committed to sharing its profits with its shareholders, with a payout ratio of 65% to 75% of Group share of net income.
FLEET DEPLOYMENT
The following operations took place during the period:
The Express-AT2 satellite launched on 16 March 2014 went into operation in early July 2014 at 140° East. Eutelsat commercialises capacity on this satellite under a partnership agreement with RSCC.
EUTELSAT 3B, launched on 25 May 2014, entered commercial service in early July 2014 to replace the EUTELSAT 3A and EUTELSAT 3D satellites at 3° East.
In mid-July 2014, EUTELSAT 3D was relocated to 7° East where it is co-positioned with EUTELSAT 7A and renamed EUTELSAT 7B.
EUTELSAT 3A was first relocated to operate in inclined orbit at 8° West and subsequently de-orbited in October 2014.
EUTELSAT 48C was de-orbited in November 2014.
EUTELSAT 16B was de-orbited in February 2015.
On 1 March 2015, EUTELSAT 115 West B was launched by a Falcon 9 rocket operated by SpaceX. It is expected to enter into service in the Fourth Quarter of calendar year 2015.
In May 2015, Eutelsat concluded a lease at 53°East for five transponders on RSCC’s Express-AM6 satellite covering Europe, MENA and Central Asia to replace the lease for 12 transponders on SESAT 2. This capacity is operated under the name EUTELSAT 53A.
Following the entry into service in June 2015 of ASTRA 2G (owned by SES), Eutelsat transferred customers from EUTELSAT 28A to capacity contracted on ASTRA 2E, ASTRA 2F and ASTRA 2G. This capacity is operated respectively under the names EUTELSAT 28E, EUTELSAT 28F and EUTELSAT 28G.
EUTELSAT 28A has been relocated at 33° East where it is co-positioned with EUTELSAT 33B and operates under the name EUTELSAT 33C.
Long term lease agreements with RSCC at 56° East have been reviewed, leading to the return of three
transponders at this position.
The upcoming launch schedule is indicated below. Compared to the update given on 12 May 2015:
- The launch of EUTELSAT 9B is now scheduled for the Fourth Quarter of calendar year 2015 (previously for the Third Quarter of calendar year 2015).
- The launch of EUTELSAT 65 West A is now scheduled for the Second Half of calendar year 2016 (previously for the Second Quarter of calendar year 2016).
Nominal launch schedule
| Satellite1 | Orbital position |
Estimated launch (calendar year) |
Main applications | Main geographic coverage | Physical Transponders | 36 MHz- equivalent transponders / Spotbeams | Of which expansion36 MHz-equivalent transponders |
| EUTELSAT 8 West B | 7°/8° West | 20 August 2015 | Video, Data | Middle East, Africa, South America | 40 Ku / 10 C | 42 Ku 20 C | 6 Ku 20 C |
| EUTELSAT 36C2 | 36° East | Q4 2015 | Video, Data, Broadband | Russia, Sub-Saharan Africa | Up to 52 Ku / 18 Ka-band spotbeams | 48 Ku 18 Ka Spotbeams | 19 Ku 18 Ka Spotbeams3 |
| EUTELSAT 9B | 9° East | Q4 2015 | Video | Europe | 50 Ku | 47Ku | 12 Ku |
| EUTELSAT 117 West B | 116.8 ° West | Q4 2015 | Video, Data, Government Services | Latin America | 40 Ku | 48 Ku | 48 Ku |
| EUTELSAT 65 West A | 65° West | H2 2016 | Video, Data, Broadband | Latin America | 24 Ku, 10 C, up to 24 Ka-band spotbeams | 24 Ku; 15 C; 24 Ka-band spotbeams | 24 Ku; 15 C; 24 Ka-band spotbeams4 |
| EUTELSAT 172B | 172° East | H1 2017 | Data, Government Services, Mobility | Asia-Pacific | 36 Ku (regular), 14 C, 11 Ku-band HTS spotbeams | 42 Ku (regular), 24 C, 11 Ku-band HTS spotbeams | 19 Ku (regular); 11 Ku-band HTS spotbeams5 |
1 Chemical propulsion satellites generally enter into service 1 to 2 months after launch. Of the electric propulsion satellites, EUTELSAT 117 West B will take 7-9 months after launch to enter into service, and EUTELSAT 172B circa 4 months. 2 Partnership with RSCC 3 Total capacity of the high throughput payload: 11.6 Gbps
4 Total capacity of the high throughput payload: 37.5 Gbps
5 Total capacity of the high throughput payload: 1.8 Gbps
Eutelsat Quantum
In December 2014, Eutelsat announced the development of the software-defined "Eutelsat Quantum" class of satellites that will set new standards in terms of coverage, bandwidth, power and frequency configurability for governnment, mobility and data markets. In July 2015, a Public-Private Partnership was signed by Eutelsat, ESA, and Airbus Defence and Space for the development of the core technologies integrated into Eutelsat Quantum. The first satellite was ordered from Airbus Defence and Space, to be delivered at the end of 2018.
CORPORATE GOVERNANCE
The Annual General Meeting of Shareholders held on 7 November 2014 renewed the offices as Directors of both Bpifrance Participations SA and Ross McInnes for a term of four years.
Regarding French law No. 2014-384 of 29 March 2014, aimed at “winning back real economy” the Annual General Meeting voted to use the option provided under Article L. 225-123, paragraph 3 of the Commercial Code and exclude the double voting rights provided in such article. Article 12, paragraph 3 of the articles of association has been accordingly amended.
The Board of 29 July 2015 called on the shareholder present at the Annual General Meeting of 5 November 2015 to vote notably on the following resolutions:
- Approval of the accounts;
- Dividend relating to Financial Year 2014-2015;
- Financial resolutions;
- Renewal of the mandate of Lord Birt;
- Appointment of Mr Jean d’Arthuis, permanent representative of Bpifrance Participations, as a board member. Bpifrance Participations will henceforth be represented by Mrs. Stéphanie Frachet;
- Appointment of Mrs Ana Garcia Fau as a Board member.
***
Notes: This press release contains audited consolidated financial statements prepared under IFRS, reviewed by the Audit Committee on 28 July 2015 and adopted by the Board of Directors of Eutelsat Communications on 29 July 2015. These accounts will be subject to the approval of shareholders of Eutelsat Communications at the Annual General Shareholders Meeting of 5 November 2015.
Documentation
Consolidated accounts are available at www.eutelsat.com/investors/index.html
Results presentation
Eutelsat Communications will hold a results presentation on Thursday, 30 July 2015 at its headquarters,
70, rue Balard, 75015 Paris, starting at 9:30 CET.
To listen by conference call please dial the following numbers:
+ 33 (0) 1 72 00 15 10 (from France)
+ 44 (0) 203 043 2440 (from Europe)
Access code: 980557#
There will also be a live webcast on our website via the home page Investor Relations at:http://www.eutelsat.com/en/investors.html
A replay will be available from 30 July, 13:00 CET to 10 August, 09:00 CET by dialing the following numbers: + 33 (0) 1 72 00 15 00(from France)
+ 44 (0) 203 367 9460 from Europe)
Access code:295578#
Financial calendar
Note: The financial calendar is provided for information purposes only. It is subject to change and will be regularly updated.
-28 October 2015: First Quarter 2015-2016 revenues
-5 November 2015: Annual General Shareholders Meeting
Disclaimer
The forward-looking statements included herein are for illustrative purposes only and are based on management’s current views and assumptions. Such forward-looking statements involve known and unknown risks. For illustrative purposes only, such risks include but are not limited to: postponement of any ground or in-orbit investments and launches including but not limited to delays of future launches of satellites; impact of financial crisis on customers and suppliers; trends in Fixed Satellite Services markets; development of Digital Terrestrial Television and High Definition television; development of satellite broadband services; Eutelsat Communications’ ability to develop and market Value-Added Services and meet market demand; the effects of competing technologies developed and expected intense competition generally in its main markets; profitability of its expansion strategy; partial or total loss of a satellite at launch or in-orbit; supply conditions of satellites and launch systems; satellite or third-party launch failures affecting launch schedules of future satellites; litigation; ability to establish and maintain strategic relationships in its major businesses; and the effect of future acquisitions and investments.
Eutelsat Communications expressly disclaims any obligation or undertaking to update or revise any projections, forecasts or estimates contained in this presentation to reflect any change in events, conditions, assumptions or circumstances on which any such statements are based, unless so required by applicable law.
APPENDICES
Revenues by business application in the Fourth Quarter (€ millions)
|
In € millions |
Q4 2013-14 reported | Q4 2013-14 restated | Q4 2014-15 | Actual change | Like-for-like change |
| Video Applications | 226.4 | 221.7 | 235.3 | +6.1% | +3.3% |
| Data Services | 53.4 | 52.5 | 61.1 | +16.3% | -0.3% |
| Value-Added Services | 25.0 | 25.0 | 27.6 | +10.4% | +9.5% |
| Government Services | 43.1 | 43.2 | 54.7 | +26.6% | +3.1% |
| Other revenues | 10.3 | 10.0 | 7.1 | -28.6% | -32.0% |
| Sub-total | 358.2 | 352.5 | 385.9 | +9.5% | +2.1% |
| Non-recurring revenues | - | - | - | - | - |
| Total | 358.2 | 352.5 | 385.9 | +9.5% | +2.1% |
| EUR/USD exchange rate | 1,372 | - | 1,097 | - | - |
| Twelve months ended June 30 | 2014 | 2015 | Change |
| Revenues | 1,347.9 | 1,476.4 | +9.5% |
| Operating expenses[10] | (314.7) | (344.7) | +9.5% |
| EBITDA | 1,033.2 | 1,131.7 | +9.5% |
| Depreciation and amortisation[11] | (401.3) | (466.5) | +16.3% |
| Other operating income (charges) | (8.5) | (3.7) | ns |
| Operating income | 623.4 | 661.5 | +6.1% |
| Financial result | (132.3) | (116.0) | (12.3%) |
| Income tax expense | (189.8) | (194.1) | +2.3% |
| Income from associates | 14.9 | 18.8 | +26.2% |
| Portion of net income attributable to non-controlling interests | (13.1) | (15.0) | +14.6% |
| Group share of net income | 303.2 | 355.2 | +17.2% |
|
|
|
30 June 2014 | 30 June 2015 |
| Net debt at the beginning of the period | €m | 2,647 | 3,779 |
| Net debt at the end of the period | €m | 3,779 | 3,841 |
| Net debt / EBITDA as reported | X | 3.7 | 3.4 |
| Net debt / EBITDA as proforma* | X | 3.5 | - |
*Calculation based on:-Reported net debt as of end-June 2014
-Proforma EBITDA including July to December 2013 Satmex EBITDA of USD 51.0 million converted at 1.349
Net debt includes all bank debt, bonds and all liabilities from long-term lease agreements, less cash and cash equivalents (net of bank overdraft).
Change in net debt (€ millions)
| Twelve months ended June 30 | 2015 |
| Net cash flows from operating activities | 1,034.6 |
| Capital expenditure[12] | (492.9) |
| Operating free cash flows | 541.7 |
| Interest and other fees paid, net | (149.4) |
| Acquisition / disposal of equity investments and subsidiaries (net of cash acquired) | - |
| Distributions to shareholders (including non-controlling interests) | (87.4) |
| Gross debt of Satmex as of end-December 2013[13] | - |
| Change in long-life leases (including the short-term portion of these leases) | (213.8) |
| Change in foreign exchange portion of the cross-currency swap | (117.5) |
| Other | (35.7) |
| Decrease (increase) in net debt | (62.1) |
| Twelve months ended June 30 | 2015 |
| Acquisitions of satellites, other property and equipment and intangible assets | 456.7 |
| Repayments of ECA loans and long-term capital leases | 36.2 |
| Capex per financial outlook definition | 492.9 |
|
|
30 June 2014 |
30 Sept. 2014 |
31 Dec. 2014 |
31 March 2015 |
30 June 2015 |
| Physical transponders – as reported (including high throughput capacity)[14] | |||||
| Operational transponders | 996 | 1,033 | 1,033 | 1,035 | 1,033 |
| Leased transponders | 784 | 785 | 788 | 793 | 801 |
| Fill rate | 78.7% | 76.0% | 76.3% | 76.6% | 77.6% |
| 36 Mhz-equivalent transponders (regular capacity only)[15] | |||||
| Operational 36 Mhz-equivalent transponders | 1,122 | 1,177 | 1,177 | 1,181 | 1,168 |
| Leased 36 Mhz-equivalent transponders | 911 | 906 | 910 | 916 | 919 |
| Fill rate | 81.2% | 77.0% | 77.3% | 77.6% | 78.7% |
|
|
Three months ended | |||
| In millions of euros | 30/09/2014 | 31/12/2014 | 31/03/2015 | 30/06/2015 |
| Video Applications | 227.6 | 224.8 | 225.3 | 235.3 |
| Data Services | 51.2 | 56.2 | 58.1 | 61.1 |
| Value-Added Services | 26.3 | 25.1 | 23.4 | 27.6 |
| Government Services | 44.5 | 47.7 | 49.5 | 54.7 |
| Other revenues | 8.0 | 11.4 | 11.4 | 7.1 |
| Sub-total | 357.6 | 365.3 | 367.7 | 385.9 |
| Non-recurring revenues | - | - | - | - |
| Total | 357.6 | 365.3 | 367.7 | 385.9 |
|
|
Three months ended | |||
| In millions of euros | 30/09/2013 | 31/12/2013 | 31/03/2014 | 30/06/2014 |
| Video Applications | 217.1 | 213.5 | 220.3 | 226.4 |
| Data | 43.2 | 40.6 | 52.5 | 53.4 |
| Value-Added Services | 23.0 | 20.1 | 20.5 | 25.0 |
| Government Services | 36.8 | 36.7 | 41.1 | 43.1 |
| Other revenues | 3.0 | 12.8 | 7.8 | 10.3 |
| Sub-total | 323.2 | 323.7 | 342.3 | 358.2 |
| Non-recurring revenues | 0.3 | 0.2 | - | - |
| Total | 323.5 | 323.9 | 342.3 | 358.2 |
Quarterly restated revenues by business application
As of First Quarter 2014-15, published revenues take account of changes in perimeter (acquisition of Satmex, disposal of KabelKiosk) as well as several reclassifications between the various applications in order to better reflect the final usage of the capacity. The table below shows restated revenues using the same basis as FY 2014-15:
|
|
Three months ended | |||
| In millions of euros | 30/09/2013 | 31/12/2013 | 31/03/2014 | 30/06/2014 |
| Video Applications | 220.7 | 215.2 | 214.7 | 221.7 |
| Data Services | 54.2 | 52.0 | 50.6 | 52.5 |
| Value-Added Services | 23.0 | 20.1 | 20.5 | 25.0 |
| Government Services | 43.6 | 43.8 | 44.0 | 43.2 |
| Other revenues | 2.6 | 11.9 | 7.8 | 10.0 |
| Sub-total | 344.1 | 343.0 | 337.7 | 352.5 |
| Non-recurring revenues | 0.3 | 0.2 | - | - |
| Total | 344.4 | 343.2 | 337.7 | 352.5 |
[1]At constant currency and perimeter, excluding non-recurring revenues.
[2]Operating income before depreciation and amortisation, impairments and other operating income/(expenses).
[3]On a proforma basis, taking into account proforma EBITDA including July to December 2013 Satmex EBITDA of USD51.0 million converted at EUR/USD exchange rate of 1.349.
[4]i) All revenue growth rates are expressed in comparison with restated figures for the corresponding period of the previous fiscal year, are at constant currency and exclude non-recurring revenues. Please refer to the appendix for more detail; ii) the share of each application as a percentage of total revenues is calculated excluding “other revenues” and “non-recurring revenues”.
[5]Other revenues include mainly compensation paid on the settlement of business-related litigation, the financing of certain research programmes by the European Union and other organisations, the impact of EUR/USD currency hedging, the provision of various services or consulting/engineering fees as well as termination fees.
[6]Number of transponders on satellites in stable orbit, back-up capacity excluded.
[7]Number of 36 MHz-equivalent transponders leased on satellites in stable orbit.
[8]This includes capital expenditures and payments under existing export credit facilities and under long-term lease agreements on third party capacity.
[9]This includes capital expenditures and payments under existing export credit facilities and under long-term lease agreements on third party capacity.
[10] Operating expenses is defined as the sum of operating costs and of selling, general & administrative expenses.
[11] Comprises amortisation expense of €56.2 million corresponding to the intangible asset “Customer Contracts and Relationships”.
[12] Including capital expenditures and payments under existing export credit facilities and under long-term lease agreements on third party capacity
[13] Gross debt of Satmex as of 31 December 2013 of USD 360.0 million at a 1.378 EUR/USD exchange rate.
[14] KA-SAT’s 82 spot beams as well as EUTELSAT 3B’s 5 Ka-band spot beams are considered transponder equivalents. KA-SAT’s fill rate is considered to be at 100% when 70% of the capacity is taken up.
[15] Excluding high throughput capacity
Related links
Topics
Categories
About Eutelsat Communications
Established in 1977, Eutelsat Communications (Euronext Paris: ETL, ISIN code: FR0010221234) is one of the world's leading and most experienced operators of communications satellites. The company provides capacity on 37 satellites to clients that include broadcasters and broadcasting associations, pay-TV operators, video, data and Internet service providers, enterprises and government agencies.
Eutelsat’s satellites provide ubiquitous coverage of Europe, the Middle East, Africa, Asia-Pacific and the Americas, enabling video, data, broadband and government communications to be established irrespective of a user’s location.
Headquartered in Paris, with offices and teleports around the globe, Eutelsat represents a workforce of 1,000 men and women from 32 countries who are experts in their fields and work with clients to deliver the highest quality of service.
For more about Eutelsat please visit www.eutelsat.com
Press
Vanessa O’Connor Tel: + 33 1 53 98 37 91
voconnor@eutelsat.com
Marie-Sophie Ecuer Tel: + 33 1 53 98 37 91
mecuer@eutelsat.com
Investors and analysts
Joanna Darlington Tel. : +33 1 53 98 35 30
jdarlington@eutelsat.com
Cédric Pugni Tel. : +33 1 53 98 35 30
cpugni@eutelsat.com
Follow us at:
![]()
![]()
![]()
![]()
![]()
![]()