Press release —
FIRST HALF 2014-2015 RESULTS
Results in line with objectives
First Half revenues of €723 million up 4.3% on a like-for-like basis1
High level of profitability: EBITDA margin of 77.4%
Net attributable income of €161 million up 9.1%, net margin of 22.2%
Strong backlog of €6.1 billion, 4.4 years of revenues
Full-year and three-year financial targets confirmed
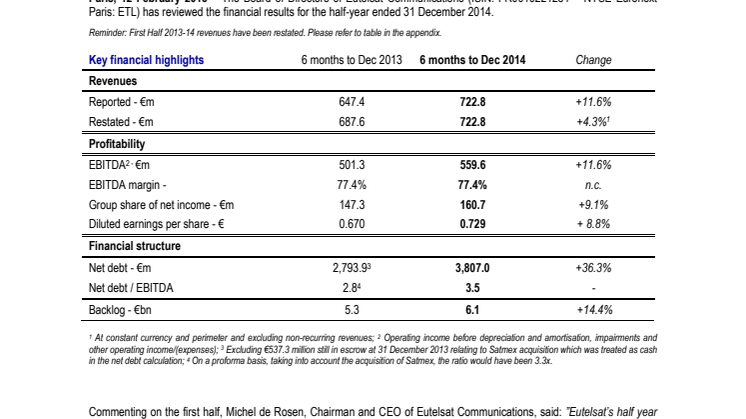
Paris, 12 February 2015 – The Board of Directors of Eutelsat Communications (ISIN: FR0010221234 – NYSE Euronext Paris: ETL) has reviewed the financial results for the half-year ended 31 December 2014.
Reminder: First Half 2013-14 revenues have been restated. Please refer to table in the appendix.
| Key financial highlights | 6 months to Dec 2013 | 6 months to Dec 2014 | Change |
| Revenues | |||
| Reported - €m | 647.4 | 722.8 | +11.6% |
| Restated - €m | 687.6 | 722.8 | +4.3%1 |
| Profitability | |||
| EBITDA 2 - €m | 501.3 | 559.6 | +11.6% |
| EBITDA margin - | 77.4% | 77.4% | n.c. |
| Group share of net income - €m | 147.3 | 160.7 | +9.1% |
| Diluted earnings per share - € | 0.670 | 0.729 | + 8.8% |
| Financial structure | |||
| Net debt - €m | 2,793.9 3 | 3,807.0 | +36.3% |
| Net debt / EBITDA | 2.8 4 | 3.5 | - |
| Backlog - €bn | 5.3 | 6.1 | +14.4% |
1 At constant currency and perimeter and excluding non-recurring revenues; 2 Operating income before depreciation and amortisation, impairments and other operating income/(expenses); 3 Excluding €537.3 million still in escrow at 31 December 2013 relating to Satmex acquisition which was treated as cash in the net debt calculation; 4 On a proforma basis, taking into account the acquisition of Satmex, the ratio would have been 3.3x.
Commenting on the first half, Michel de Rosen, Chairman and CEO of Eutelsat Communications, said: ”Eutelsat’s half year results were in line with objectives, with like-for-like revenue growth of 4.3%, and an EBITDA margin of 77.4%. Video revenues are benefiting from additional capacity launched last year and from the positive dynamics of the Latin American market. Revenue trends in Data showed a slight improvement, while Value-Added Services reflected uptake on KA-SAT. In Government Services new contracts offset the lower renewals of the previous twelve months. A year on from its consolidation, Satmex continues to deliver in line with expectations and contributed positively to all applications.
Based on performance of the first half, we remain on track to meet our full year objectives, in the context of a tougher comparison basis in the second half and the current environment in Russia. Our targets for the next two years are also confirmed. We are confident in the longer-term demand trends in our industry, and we are investing in our future development with industry-leading innovation projects like Eutelsat Quantum”.
This press release contains unaudited condensed consolidated half-year accounts prepared under IFRS which were reviewed by the Audit Committee on 10 February 2015 and approved by the Board of Directors of Eutelsat Communications on 11 February 2015.
REVENUES[1]
|
In € millions |
Reminder: reported H1 2013-14 | Restated H1 2013-14 | ReportedH1 2014-15 | Actual change vs. reported | Actual change vs. restated | Like-for-like change1 vs. restated |
| Video Applications | 430.5 | 435.8 | 452.4 | +5.1% | +3.8% | +3.5% |
| Data Services | 83.8 | 106.1 | 107.4 | +28.1% | +1.2% | -0.7% |
| Value-Added Services | 43.2 | 43.2 | 51.4 | +19.0% | +19.0% | +18.8% |
| Government Services | 73.6 | 87.5 | 92.2 | +25.4% | +5.5% | +2.7% |
| Other revenues | 15.8 | 14.5 | 19.4 | ns | ns | ns |
| Sub-total | 646.9 | 687.1 | 722.8 | +11.7% | +5.2% | +4.3% |
| Non-recurring revenues | 0.5 | 0.5 | - | - | - | - |
| Total | 647.4 | 687.6 | 722.8 | +11.6% | +5.1% | +4.2% |
1 At constant currency and perimeter
Total first half revenues for the Group stood at €722.8 million, up 4.3% on a pro-forma basis at constant currency and excluding non-recurring revenues. The appreciation of the dollar relative to the euro added 0.9 points to top-line growth, particularly represented in Government Services and to a lesser extent Data.
VIDEO APPLICATIONS (65% of revenues)
Revenues from Video Applications were up 3.5% in the first half to €452.4 million. This reflected the entry into service of the Express-AT1 satellite, which was operational for the full semester, resources added at the 7°/8° West position in September 2013 and the good performance of Satmex.
Significant contracts included the multi-year renewal of seven transponders at Eutelsat’s HOT BIRD video neighbourhood by nc+, the Polish Pay-TV operator.
At 31 December 2014, the total number of channels broadcast by Eutelsat satellites stood at 5,741. Excluding Satmex (307 channels broadcasting at 31 December 2014), the channel count was up 13% year-on-year. HDTV penetration continued to increase, representing 11.4% of channels at 31 December 2014 compared to 10.6% a year before. A total of 657 channels were broadcasting in High Definition across Eutelsat’s fleet at the end of the first half, up from 508 a year earlier.
Research published at the beginning of January by the Eutelsat TV Observatory showed that the number of homes receiving channels broadcast by eight of Eutelsat’s flagship television neighbourhoods serving Europe, Russia, North Africa and the Middle East now stands at 274 million, up by 32% since 2010, of which 138 million receive channels from the HOT BIRD neighbourhood. Direct-to-Home remains the leading reception mode across the combined Europe, Russia, North Africa and Middle East footprint. The number of Direct-to-Home households is growing, up by 44% to 160 million homes between 2010 and 2014.
DATA SERVICES (15% of revenues)
Data Services first half revenues stood at €107.4 million, down 0.7% year-on-year. The take-up of capacity on EUTELSAT 3B with clients including some telecom operators in the Middle-East, and the ongoing solid performance of Satmex offset less favourable trends in general in the EMEA region.
On a sequential quarterly basis, the underlying trend showed an improvement, with a slight uptick in growth in the second quarter, following three quarters of stability on a like-for-like basis.
VALUE-ADDED SERVICES (7% of revenues)
Value-Added Services first half revenues amounted to €51.4 million, up 18.8%.Uptake on KA-SAT continued albeit at a slower pace, with 175,000 broadband terminals activated at 31 December 2014, up from 124,000 a year earlier, and 166,000 at 30 September 2014. The distribution network for the Tooway consumer broadband service was further expanded with agreements signed with OTE in Greece and Telekom Austria Group in Central and Eastern Europe.
As in previous years the second quarter reflected the seasonality of the maritime market.
GOVERNMENT SERVICES (13% of revenues)
First half revenues from Government Services stood at €92.2 million, up 2.7%. This growth reflected new contracts on EUTELSAT 33B, EUTELSAT 36B and EUTELSAT 48D, the good performance of Satmex and the impact of the lower level of contract renewals in the last twelve months.
OTHER[2] AND NON-RECURRING REVENUES
Other revenues amounted to €19.4 million compared with €14.5 million at 31 December 2013, reflecting notably revenues related to the agreements with SES at 28°5 East.
There were no non-recurring revenues at 31 December 2014.
OPERATIONAL AND LEASED TRANSPONDERS
The number of operational transponders at 31 December 2014 was up by 178 year-on-year to 1,033, reflecting mainly the entry into service of Express-AT1 and EUTELSAT 3B as well as the integration of Satmex.
The fill rate stood at 76.3% compared to 74.8% a year earlier, reflecting mainly the entry into service of Express-AT1, which was fully leased, the integration of Satmex, whose fill is rate above Group average and further take-up on KA-SAT.
The slight increase of fill rate compared to the end of September 2014 reflected notably the ramp-up of new capacity at 3° East (EUTELSAT 3B) and 7° East (EUTELSAT 7B).
|
|
31 December
2013 |
30 September 2014 | 31 December2014 |
| Number of operational transponders [3] | 855 | 1,033 | 1,033 |
| Number of leased transponders [4] | 640 | 785 | 788 |
| Fill rate | 74.8% | 76.0% | 76.3% |
Note: KA-SAT’s 82 spot beams as well as EUTELSAT 3B’s 5 Ka-band spot beams are considered transponder equivalents. KA-SAT’s fill rate is considered to be at 100% when 70% of the capacity is taken up.
ORDER BACKLOG
The order backlog [5] stood at €6.1 billion at 31 December 2014, up by 14% year-on-year including Satmex and by 8% excluding Satmex. It was equivalent to 4.4 times 2013-14 revenues. Video Applications represented 84% of the backlog.
The slight decline in backlog compared with end-September reflects, on one hand, new contracts at 3° East, 7° East and 16° East, and on the other, backlog consumption. However, the renewal at HOT BIRD capacity with nc+ was not integrated into the backlog at end-December. Including the latter, the level of backlog would have been stable versus end-September.
|
|
31 December 2013 | 30 September 2014 | 31 December2014 |
| Value of contracts (in billions of euros) | 5.3 | 6.3 | 6.1 |
| In years of annual revenues based on last fiscal year | 4.1 | 4.5[6] | 4.46 |
| Share of Video Applications | 94% | 84% | 84% |
PROFITABILITY
EBITDA MARGIN: 77.4%
Group EBITDA amounted to €560 million compared to €501 million at 31 December 2013, reflecting the integration of Satmex and the slight beneficial effect of USD appreciation.
The EBITDA margin stood at 77.4%, unchanged compared to last year. As in previous years, the phasing of operating costs was marginally favourable to the first half.
GROUP SHARE OF NET INCOME: €161 MILLION
Group share of net income stood at €161 million versus €147 million a year earlier, a 9.1% increase and represented a margin of 22.2%.
This reflected mainly:
The increase in EBITDA;
Other operating expenses of -€2 million compared with income of €8 million last year;
Depreciation and amortisation of €232 million (up €42 million year-on-year) principally reflecting the integration of Satmex and the entry into service of EUTELSAT 25B (October 2013), Express-AT1 [7] (May 2014), Express-AT27 (July 2014) and EUTELSAT 3B (July 2014);
A financial result of -€56 million versus -€65 million a year earlier, reflecting the full impact of the €930 million bond raised in December 2013, a positive variation in the foreign exchange result of €19 million (income of €15 million in first half 2014-15 versus negative result of -€4 million a year earlier) and higher capitalised interest;
A tax rate of 40.4% versus 42.6% in first half 2013-14 which had included a €5.6 million settlement relating to a French tax audit.
STRONG CASH FLOW GENERATION
First half net cash flows from operating activities amounted to €504 million, representing 70% of revenues, versus €325 million in First Half 2013-14. This reflected mainly the increase in EBITDA (€58 million) and a reduction in tax paid (€85 million) relating to the evolution of the pretax profit and the timing of tax payments.
Capital expenditure amounted to €205 million in First Half 2014-15 compared to €148 million a year earlier, reflecting the consolidation of Satmex over the full period as well as the phasing of various satellite programmes.
FINANCIAL STRUCTURE
At 31 December 2014, net debt was broadly stable at €3,807 million versus €3,779 million at 30 June 2014. Free cash-flow generation largely offset the dividend payment (€87 million), interest and other fees (€30 million) and an increase in financial leases (€111 million) linked notably to the entry into service of Express-AT2. The net debt to EBITDA ratio stood at 3.5 times, stable on end-June 2014.
The weighted average maturity of the Group’s debt stood at 3.9 years, compared to 4.4 years at 30 June 2014. The average cost of debt after hedging was 3.8% in the first half.
Liquidity remains strong, with cash of €469 million and undrawn credit lines of €650 million.
OUTLOOK
Based on the performance of the First Half, Eutelsat remains on track to meet its full year objective of growth of around 4% at constant currency, excluding non-recurring revenues and on a pro-forma basis [8], in the context of a tougher comparison basis in the second half and the currentenvironment in Russia. The EBITDA margin remains targeted at above 76.5%.
All other targets published in July 2014 are also confirmed on the basis of the nominal deployment plan published hereunder.
FLEET DEPLOYMENT PROGRAMME
The following operations took place during the period:
The Express-AT2 satellite launched on 16 March 2014 went into operation in early July 2014 at 140° East. Eutelsat commercialises capacity on this satellite under a partnership agreement with RSCC.
EUTELSAT 3B, launched on 25 May 2014, entered commercial service in early July 2014 and replaced the EUTELSAT 3A and EUTELSAT 3D satellites at 3° East.
In mid-July 2014, EUTELSAT 3D was relocated to 7° East where it is now co-positioned with EUTELSAT 7A and has been renamed EUTELSAT 7B.
EUTELSAT 3A was first relocated to operate in inclined orbit at 8° West and subsequently de-orbited at end-October 2014.
EUTELSAT 48C was de-orbited in November 2014.
EUTELSAT 16B was de-orbited in February 2015.
The upcoming launch schedule is as follows. Compared to 30 September 2014, the launch of EUTELSAT 9B is now expected in the second to third quarter of calendar year 2015 (versus second quarter previously).
Estimated launch schedule
| Satellite1 | Orbital position |
Estimated launch (calendar year) |
Main applications | Main geographic coverage | Transponders |
| EUTELSAT 115 West B | 114.9° West | Q1 2015 | Data, Government Services | Americas | 34 Ku / 12 C |
| EUTELSAT 9B | 9° East | Q2/Q3 2015 | Video | Europe | 50 Ku |
| EUTELSAT 8 West B | 7°/8° West | Q3 2015 | Video, Data | Middle East, Africa, South America | 40 Ku / 10 C |
| EUTELSAT 36C (2) | 36° East | Q4 2015 | Video, Data, Broadband | Russia, Sub-Saharan Africa | Up to 52 Ku / 18 Ka-band spotbeams |
| EUTELSAT 117 West B | 116.8 ° West | Q4 2015 | Video, Data, Government Services | Latin America | 40 Ku |
| EUTELSAT 65 West A | 65° West | Q2 2016 | Video, Data, Broadband | Latin America | 24 Ku, 10 C, up to 24 Ka-band spotbeams |
| EUTELSAT 172B | 172° East | H1 2017 | Data, Government Services, Mobility | Asia-Pacific | 36 Ku (regular), 14 C, 11 Ku-band HTS spotbeams |
| 1 Satellites generally enter into service 1 to 2 months after launch for chemical propulsion satellites. The case electric propulsion satellites, EUTELSAT 115 West B and EUTELSAT 117 West B will take 7-9 months after launch to enter into service, and EUTELSAT 172B circa 4 months.2 Partnership with RSCC |
Eutelsat Quantum
In December 2014, Eutelsat announced the development of the software-defined "Eutelsat Quantum" class of satellites setting new standards in terms of coverage, bandwidth, power and frequency configurability. This premium capacity will enable customers to specifically address regions where end-users in government, mobility and data markets are located and to adapt to their changing needs. The first satellite, to be launched in 2018, will be manufactured by Airbus Defense and Space.
DIVIDEND PAYMENT
The Annual General Meeting of Shareholders held on 7 November 2014 approved the payment of a dividend of €1.03 per share for the financial year ended 30 June 2014, with the option for shareholders to receive the entire dividend either in cash or in new shares (scrip dividend). 66% of the rights were exercised in favour of the scrip dividend, leading to the issuance of 6,858,356 new shares on 11 December 2014, thereby increasing Eutelsat Communications’ share capital to 226,972,338 ordinary shares. Cash dividends were paid on 11 December 2014 for a total of €78 million.
Following these operations, Bpifrance Participations held 26.03% and China Investment Corporation 6.84% of the share capital.
RECENT DEVELOPMENTS
Environment in Russia
The general economic environment in Russia and in particular the sharp fall in the value of the rouble has put pressure on Eutelsat’s Russian customers with euro-denominated contracts. In consequence, Eutelsat is reviewing the terms of certain contracts while this situation persists. Russia represents some 5% of total revenues.
ViaSat Brazil
Following a material breach by ViaSat Brazil, Eutelsat terminated the contract signed with ViaSat Brazil for the Ka-band payload on EUTELSAT 3B. The capacity has been taken by another customer, with no impact on revenues.
ViaSat Brazil is seeking redress from Eutelsat before the commercial court of Rio de Janeiro, which Eutelsat is vigorously contesting.
CORPORATE GOVERNANCE
The Annual General Meeting of Shareholders held on 7 November 2014 renewed the offices as Directors of both Bpifrance Participations SA and Ross McInnes for a term of four years.
First half 2014-2015 results conference call
A conference call will be held on
Thursday, 12 February 2015 at 9:00am CET.
To connect to the call, please use the following numbers:
+ 33 1 76 77 22 22 (France)
+ 44 (0) 20 3427 1900 (UK)
+ 1 646 254 3366 (USA)
Access code: 8939379#
The presentation will also be available via webcast at http://www.eutelsat.com/en/investors.html
Recording available from 12 February 2:00pm to 19 February, midnight CET.
+ 33 1 74 20 28 00 (France)
+ 44 (0) 20 3427 0598 (UK)
+ 1 347 366 9565 (USA)
Access code: 8939379#
Documentation
Consolidated accounts are available at www.eutelsat.com/investors/index.html
Financial calendar
The financial calendar below is provided for information purposes only. It is subject to change and will be regularly updated.
-12 May 2015: Third quarter 2014-2015 revenues
-30 July 2015: Full year 2014-2015 earnings
APPENDICES
Extract from the consolidated income statement (in € millions)
| Six months ended December 31 | 2013 | 2014 | Change |
| Revenues | 647.4 | 722.8 | + 11.6% |
| Operating expenses | (146.1) | (163.2) | + 11.7% |
| EBITDA | 501.3 | 559.6 | + 11.6% |
| Depreciation and amortisation | (190.0) | (232.3) | + 22.3% |
| Other operating income (expenses) | 8.4 | (2.1) | n.a. |
| Operating income | 319.7 | 325.2 | + 1.7% |
| Financial result | (64.8) | (56.2) | - 13.2% |
| Income tax expense | (108.6) | (108.6) | n.c. |
| Income from associates | 7.3 | 7.7 | + 4.6% |
| Portion of net income attributable to non-controlling interests | (6.4) | (7.2) | + 12.5% |
| Group share of net income | 147.3 | 160.7 | + 9.1% |
|
|
|
31 Dec. 2013 | 31 Dec. 2014 |
| Net debt at the beginning of the period | €m | 2,647 | 3,779 |
| Net debt at the end of the period | €m | 2,794 [9] | 3,807 |
| Net debt / EBITDA (Last twelve months) | X | 2.8 [10] | 3.5 |
| Period ending | Half-year ending 31/12/2013 | Full-year ending 30/06/2014 | Half-year ending 31/12/2014 |
| Net cash flows from operating activities | 325.1 | 777.6 | 504.1 |
| Capital expenditure | (148.2) | (439.6) | (204.8) |
| Operating free cash flows | 176.9 | 338.0 | 299.3 |
| Interest and other fees paid, net | (21.8) | (127.2) | (30.0) |
| Acquisition / disposal of equity investments and subsidiaries (net of cash acquired) | (27.2) [11] | (550.1) | 1.9 |
| Distributions to shareholders (incl. non-controlling interests) | (249.5) | (249.5) | (87.4) |
| Gross debt of Satmex as of end-December 2013 | - | (261.2) [12] | - |
| Change in long-life leases(including the short-term portion of these leases) | 2.1 | (212.9) | (110.8) |
| Other revenues | (28.0) ) | ( 69.6) | (101.0) ) |
| Decrease (increase) in net debt | (147.5) | (1,132.5) | (28.0) |
Capex per financial outlook definition (in € millions)
|
|
Half-year ending 31/12/2014 |
| Acquisitions of satellites, other property and equipment and intangible assets | 204.8 |
| Repayments of ECA loans and long-term capital leases | 12.1 |
| Capex per financial outlook definition | 216.9 |
|
|
3 months ended | |||||
| In millions of euros | 30/09/2013 | 31/12/2013 | 31/03/2014 | 30/06/2014 | 30/09/2014 | 31/12/2014 |
|
|
reported | reported | reported | reported | reported | reported |
| Video Applications | 217.1 | 213.5 | 220.3 | 226.4 | 227.6 | 224.8 |
| Data Services | 43.2 | 40.6 | 52.5 | 53.4 | 51.2 | 56.2 |
| Value-Added Services | 23.0 | 20.1 | 20.5 | 25.0 | 26.3 | 25.1 |
| Government Services | 36.8 | 36.7 | 41.1 | 43.1 | 44.5 | 47.7 |
| Other revenues | 3.0 | 12.8 | 7.8 | 10.3 | 8.0 | 11.4 |
| Sub-total | 323.2 | 323.7 | 342.3 | 358.2 | 357.6 | 365.3 |
| Non-recurring revenues | 0.3 | 0.2 | - | - | - | - |
| Total | 323.5 | 323.9 | 342.3 | 358.2 | 357.6 | 365.3 |
Quarterly restated revenues by business application
As of Q1 2014-2015, published revenues take account of changes in perimeter (acquisition of Satmex, disposal of KabelKiosk) as well as several reclassifications between the various applications in order to better reflect the final usage of the capacity.
The table below shows restated revenues using the same basis as financial year 2014-2015:
|
|
3 months ended | |||||
| In millions of euros | 30/09/2013 | 31/12/2013 | 31/03/2014 | 30/06/2014 | 30/09/2014 | 31/12/2014 |
|
|
restated | restated | restated | restated | reported | reported |
| Video Applications | 220.7 | 215.2 | 214.7 | 221.7 | 227.6 | 224.8 |
| Data Services | 54.2 | 52.0 | 50.6 | 52.5 | 51.2 | 56.2 |
| Value-Added Services | 23.0 | 20.1 | 20.5 | 25.0 | 26.3 | 25.1 |
| Government Services | 43.6 | 43.8 | 44.0 | 43.2 | 44.5 | 47.7 |
| Other revenues | 2.6 | 11.9 | 7.8 | 10.0 | 8.0 | 11.4 |
| Sub-total | 344.1 | 343.0 | 337.7 | 352.5 | 357.6 | 365.3 |
| Non-recurring revenues | 0.3 | 0.2 | - | - | - | - |
| Total | 344.4 | 343.2 | 337.7 | 352.5 | 357.6 | 365.3 |
Satmex quarterly revenues by business application
|
|
Three months ended | |||
| In millions of euros | 31/03/2014 | 30/06/2014 | 30/09/2014 | 31/12/2014 |
| Video Applications | 7.3 | 8.1 | 8.2 | 9.0 |
| Data Services | 13.7 | 14.2 | 14.4 | 15.9 |
| Value-Added Services | - | - | - | - |
| Government Services | 4.4 | 4.9 | 5.2 | 6.2 |
| Other revenues | - | - | - | - |
| Sub-total | 25.4 | 27.2 | 27.9 | 31.2 |
| Non-recurring revenues | - | - | - | - |
| Total | 25.4 | 27.2 | 27.9 | 31.2 |
Disclaimer
The forward-looking statements included herein are for illustrative purposes only and are based on management’s current views and assumptions. Such forward-looking statements involve known and unknown risks. For illustrative purposes only, such risks include but are not limited to: postponement of any ground or in-orbit investments and launches including but not limited to delays of future launches of satellites; impact of financial crisis on customers and suppliers; trends in Fixed Satellite Services markets; development of Digital Terrestrial Television and High Definition television; development of satellite broadband services; Eutelsat Communications’ ability to develop and market Value-Added Services and meet market demand; the effects of competing technologies developed and expected intense competition generally in its main markets; profitability of its expansion strategy; partial or total loss of a satellite at launch or in-orbit; supply conditions of satellites and launch systems; satellite or third-party launch failures affecting launch schedules of future satellites; litigation; ability to establish and maintain strategic relationships in its major businesses; and the effect of future acquisitions and investments.
Eutelsat Communications expressly disclaims any obligation or undertaking to update or revise any projections, forecasts or estimates contained in this presentation to reflect any change in events, conditions, assumptions or circumstances on which any such statements are based, unless so required by applicable law.
[1]i) All revenue growth rates are expressed in comparison with restated figures for the corresponding period of the previous fiscal year, are at constant currency and exclude non-recurring revenues. Please refer to the appendix for more detail; ii) the share of each application as a percentage of total revenues is calculated excluding “other revenues” and “non-recurring revenues”.
[2]Other revenues mainly include compensation paid on the settlement of business-related litigation, the financing of certain research programmes by the European Union and other organisations, and the recognition of EUR/USD foreign exchange gains/losses.
[3]Number of transponders on satellites in stable orbit, back-up capacity excluded.
[4]Number of transponders leased on satellites in stable orbit.
[5]The backlog represents future revenues from capacity lease agreements and can include contracts for satellites under procurement.
[6]Based on proforma revenues for fiscal year 2013-2014.
[7]Leased capacity leading to recognition of assets in the balance sheet calculated on the basis of the discounted Net Present Value of future payments over 15 years.
[8]Based on pro-forma revenues of €1,377 million excluding non-recurring revenues for FY 2013-2014 (see note in the appendix for more details).
[9]€537.3 million transferred to an escrow account at 31 December 2013 for the acquisition of 90.1% of Satmex but treated as cash in the net debt calculation.
[10]On a proforma basis, taking into account the acquisition of Satmex, the ratio would have been 3.3x.
[11]Includes mainly €16 million relating to the disposal of Solaris Mobile Ltd. and €43.8 million for the acquisition of 9.9% of Satmex equity.
Does not include €537.3 million transferred to an escrow account at 31 December 2013 for the acquisition of the remaining 90.1% of Satmex but treated as cash in the net debt calculation.
[12] Gross debt of Satmex as of 31 December 2013 of USD360.0 million at a 1.378 EUR/USD exchange rate
Related links
Topics
Categories
About Eutelsat Communications
Established in 1977, Eutelsat Communications (Euronext Paris: ETL, ISIN code: FR0010221234) is one of the world's leading and most experienced operators of communications satellites. The company provides capacity on 34 satellites to clients that include broadcasters and broadcasting associations, pay-TV operators, video, data and Internet service providers, enterprises and government agencies.
Eutelsat’s satellites provide ubiquitous coverage of Europe, the Middle East, Africa, Asia-Pacific and the Americas, enabling video, data, broadband and government communications to be established irrespective of a user’s location.
Headquartered in Paris, with offices and teleports around the globe, Eutelsat represents a workforce of 1,000 men and women from 32 countries who are experts in their fields and work with clients to deliver the highest quality of service.
For more about Eutelsat please visit www.eutelsat.com
Press
Vanessa O’Connor Tel: + 33 1 53 98 37 91
voconnor@eutelsat.com
Marie-Sophie Ecuer Tel: + 33 1 53 98 37 91
mecuer@eutelsat.com
Investors and analysts
Joanna Darlington Tel. : +33 1 53 98 35 30
jdarlington@eutelsat.com
Cédric Pugni Tel. : +33 1 53 98 35 30
cpugni@eutelsat.com
Follow us at:
![]()
![]()
![]()
![]()
![]()
![]()